
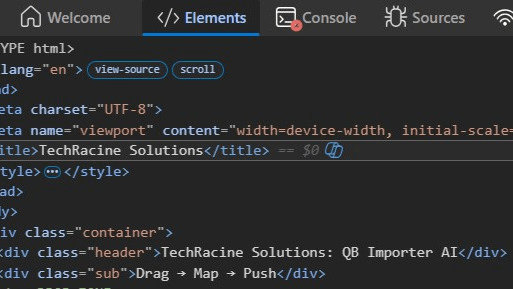
Browser DevTools are essential for debugging and optimizing web applications. This article will guide you through the fundamentals of using these powerful tools to identify and resolve issues quickly.
Whether you're a seasoned developer or just starting out, mastering Browser DevTools can significantly enhance your productivity and the performance of your applications. Let's dive into the key features and best practices for using these tools effectively.
Browser DevTools: A Practical Guide for Faster Frontend Debugging
Browser DevTools are essential for debugging and optimizing web applications. This article will guide you through the fundamentals of using these powerful tools to identify and resolve issues quickly. In modern web development, most issues don’t originate in the code editor — they surface in the browser. This is where browser DevTools become essential. DevTools provide direct visibility into how an application behaves in real time. When used effectively, they reduce debugging time, improve code quality, and eliminate guesswork.
Why DevTools Matter
DevTools allow developers to inspect and manipulate the DOM, monitor network requests, debug JavaScript, analyze performance, and more — all within the browser. This direct access to the running application is invaluable for quickly identifying and fixing issues that may not be apparent in the code alone.
Frontend issues are often tied to:
- Incorrect API responses
- Styling conflicts
- JavaScript execution errors
- Performance bottlenecks
Without proper tools, identifying these problems becomes trial and error. DevTools bring clarity by allowing developers to inspect, trace, and validate everything happening inside the browser.
Core Areas Every Developer Should Use
1️⃣ Elements Tab — UI Inspection
The Elements tab allows you to inspect and modify HTML and CSS live. You can quickly identify layout issues, spacing problems, or conflicting styles. This is often the fastest way to debug UI-related bugs. By selecting elements directly in the browser, you can see exactly how styles are applied and make adjustments on the fly to test fixes before updating your codebase.
2️⃣ Console — Real-Time Feedback
The Console provides immediate insight into what’s happening in your application. It helps:
- Log values
- Identify runtime errors
- Test small snippets of JavaScript
- Monitor API responses
A well-used console reduces unnecessary code changes during debugging.
3️⃣ Network Tab — API Visibility
Most modern applications rely heavily on APIs. The Network tab allows you to:
- Track requests and responses
- Verify payloads
- Check status codes
- Measure response time
- Identify failed requests
Many issues that appear as “UI bugs” are actually API-related, and this tab helps confirm that quickly.
4️⃣ Sources Tab — Step-by-Step Debugging
The Sources tab enables you to set breakpoints, step through code, and inspect variables in real-time. This is invaluable for understanding the flow of your application and identifying where issues might be occurring.
- Set breakpoints
- Pause execution
- Inspect variables
- Analyze call stacks
This is critical when logic becomes complex or when bugs are not immediately obvious.
5️⃣ Application Tab — Storage & Sessions
The Application tab allows you to inspect and manage the storage mechanisms used by your application, such as LocalStorage, SessionStorage, and Cookies. This is useful for debugging issues related to data persistence and user sessions. This section helps debug client-side storage:
- LocalStorage
- SessionStorage
- Cookies
It is especially useful for authentication issues, session handling, and state-related bugs.
6️⃣ Performance Tab — Optimization
The Performance tab helps you identify and resolve performance bottlenecks in your application. It provides detailed insights into CPU usage, memory consumption, and rendering performance.
- Analyze load time
- Identify slow scripts
- Understand rendering delays
It provides a clear view of where time is being spent.
7️⃣ Responsive Mode — Device Testing
The Responsive Mode in the DevTools allows you to test your application across different device sizes and orientations, ensuring it looks and functions correctly on various screens.
- Simulate different screen sizes
- Test layouts on mobile and tablet
- Identify UI breakpoints
This reduces dependency on physical devices during development.
8️⃣ Common Shortcuts
Here are some useful keyboard shortcuts in the DevTools:
- Ctrl + Shift + C (Cmd + Shift + C on Mac) — Select an element in the page
- Ctrl + Shift + I (Cmd + Option + I on Mac) — Open DevTools
- F8 — Resume script execution
- F9 — Toggle breakpoint
- F10 — Step over next function call
- F11 — Step into next function call
When Should You Use DevTools?
DevTools are not just for fixing bugs. They should be used when:
- Something behaves differently than expected
- API data does not match UI output
- UI layout breaks or looks inconsistent
- Performance feels slow
- You need to validate assumptions
Using DevTools early prevents issues from reaching production.
Common Mistake
Many developers rely only on console logs or code changes to debug issues. This approach is slow and often inaccurate. Effective debugging starts with observation, not modification — and DevTools enable that.
Conclusion
Browser DevTools are not optional utilities — they are core to modern frontend development. They provide visibility, reduce debugging time, and improve overall development efficiency. By mastering these tools, developers can quickly identify and resolve issues, leading to better code quality and faster development cycles. If you haven’t already, take the time to explore and integrate DevTools into your workflow — it will pay off in the long run.
Ready to Optimize Your Development Workflow?
TechRacine Solutions specializes in seamless CRM and accounting integrations that automate data flow, reduce manual work, and enhance financial visibility. Our expert team can help you design and implement custom API solutions tailored to your business needs.
Talk to Our Integration Team